Our experts have seen quite a bit of “hullaballoo” around Data Quality in the BI community that eventually stirs up controversy in the analyst community, with this cycle inevitably filtering down to IT departments. There are real concerns around Data Quality that arise naturally through reporting issues from BI deployments, so I thought it might be helpful to add clarification, definition and some examples from our experiences in the field with BI applications as well as custom BI deployments. For those of you that know Northcraft Analytics, we focus specifically on BI for enterprise IT departments, but these principles are broadly applicable.
Data Quality definition – The state of completeness, accessibility, accuracy, consistency, timeliness and reliability that makes data appropriate for use in operations, decision making and planning. (multiple sources merged for readability)
For the purposes of our products, we had to take a stand and make decisions that we believed would lead to the most successful BI deployments, so while these answers may seem controversial to some technologists who have chosen a different direction, we believe in the choices we made for the reasons listed below:
· Accuracy – For the best accuracy, we believe that calculations need to be maintained on the server, so there is a single source of truth for the metric.
As an example in the IT world, report users would drag a pre-calculated average resolution time for Incident Management into their report, so multiple different people do not need to define their ad-hoc calculations in various toolsets. We believe this improves accuracy.
· Completeness – We believe that completeness depends on the application deployment. For instance, let’s take 2 examples from the ITSM world:
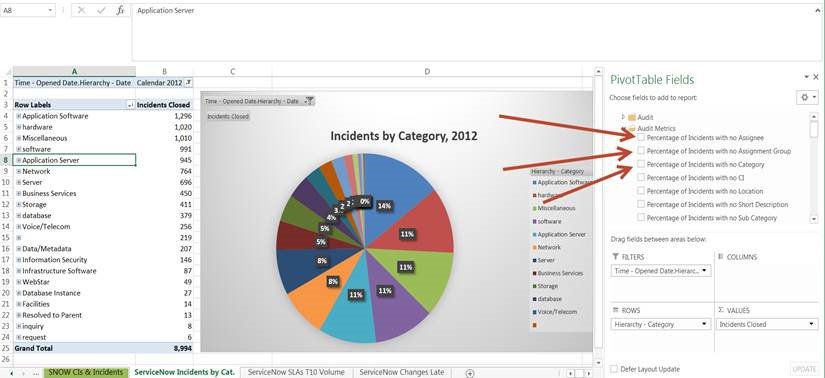
ServiceNow doesn’t have many out of the box required fields, so completeness varies by customer deployment. In fact, there is only 1 for Incident Management out of the box and that is Incident ID. So, our data quality metrics look at the completeness of the core (most heavily used fields), such as Priority, Short Description, Category, Caller, etc…
For BMC Remedy ITSM, there are MANY required fields and data validation rules out of the box. While this has an impact on usability for the IT staff, it does improve data quality in the area of completeness because users are forced to enter information in fields. Now, of course, they can just enter erroneous information for the purposes of speed, but most users do not do that.
· Timeliness – Last modified by date & time is a core part of most enterprise applications from salesforce.com to SAP, so it’s always wise to take advantage of these fields in the application as well as methods in the BI platform to let users know how recent the data is.
So, for example, our BI applications will make cube & data warehouse refresh dates and transaction level modified dates part of each report.
· Consistency across data sources – In the IT world, consider static IP address, sysname or fully qualified domain name. These are data that you would find across multiples data sources (monitoring tools, discovery systems and the ITSM platform)
As an example, if you were to use our SolarWinds BI application, you might find the fully qualified domain name of a server in both SolarWinds and the ServiceNow CMDB data sources. Choosing this as a key for joining together data sources would provide valuable information (through consistency) in both data sources, such as Event & Incident KPIs in a single report.
· Reliability – Reliability should come after completeness, and boils down to the individual (person entering the data) level.
For example, Assignee A is reliable in filling out the Subcategory field, but Assignee B is not, therefore, we can use the measures to determine that Assignee A should be responsible for training the trainer to improve the reliability of data for the rest of the team. The manager of the team is responsible for finding the most reliable data entry personnel. There are always only a few in each group (maybe only 1).
· Accessibility – We believe that self-service BI is enabled by leveraging tools that are familiar to the broadest swath of the user population, such as Excel and Tableau. So, technically, we have chosen a presentation-layer independent approach to our BI applications that give users immediate access to domain-specific knowledge for their function quickly. Basically, if you don’t have to do the calculations, but only need to focus on the presentation of the report, that’s self-service BI to us.
That’s all for today, Goodbye… or should I say… GoodBI (ugh).
Lee