Northcraft PowerScore™ IT Benchmarking Tool
Enterprise IT is undergoing massive change in terms of the shift from traditional data centers to pure cloud and hybrid IT. This shift has increased the need more than ever before for unbiased information about IT Performance across the vast landscape of data in large IT organizations who have chosen the various forms of operating models, including outsourcing, hybrid, traditional data center operations, SaaS, IaaS and everything in between. Given the nature and scope of analytical solutions that we provide for enterprise IT, such as ServiceNow, BMC, SolarWinds, JIRA, Nagios for all of the various processes and functions within IT, we have created the most comprehensive aggregate database of machine generated data on the market. With that in mind, let’s show you some of the assumptions, examples and artifacts that you’ll receive should you decide to move forward with a purchase!
- These Measures and Key Performance Indicators (KPIs) are based exclusively upon IT Organizations with > 100 IT Staff.
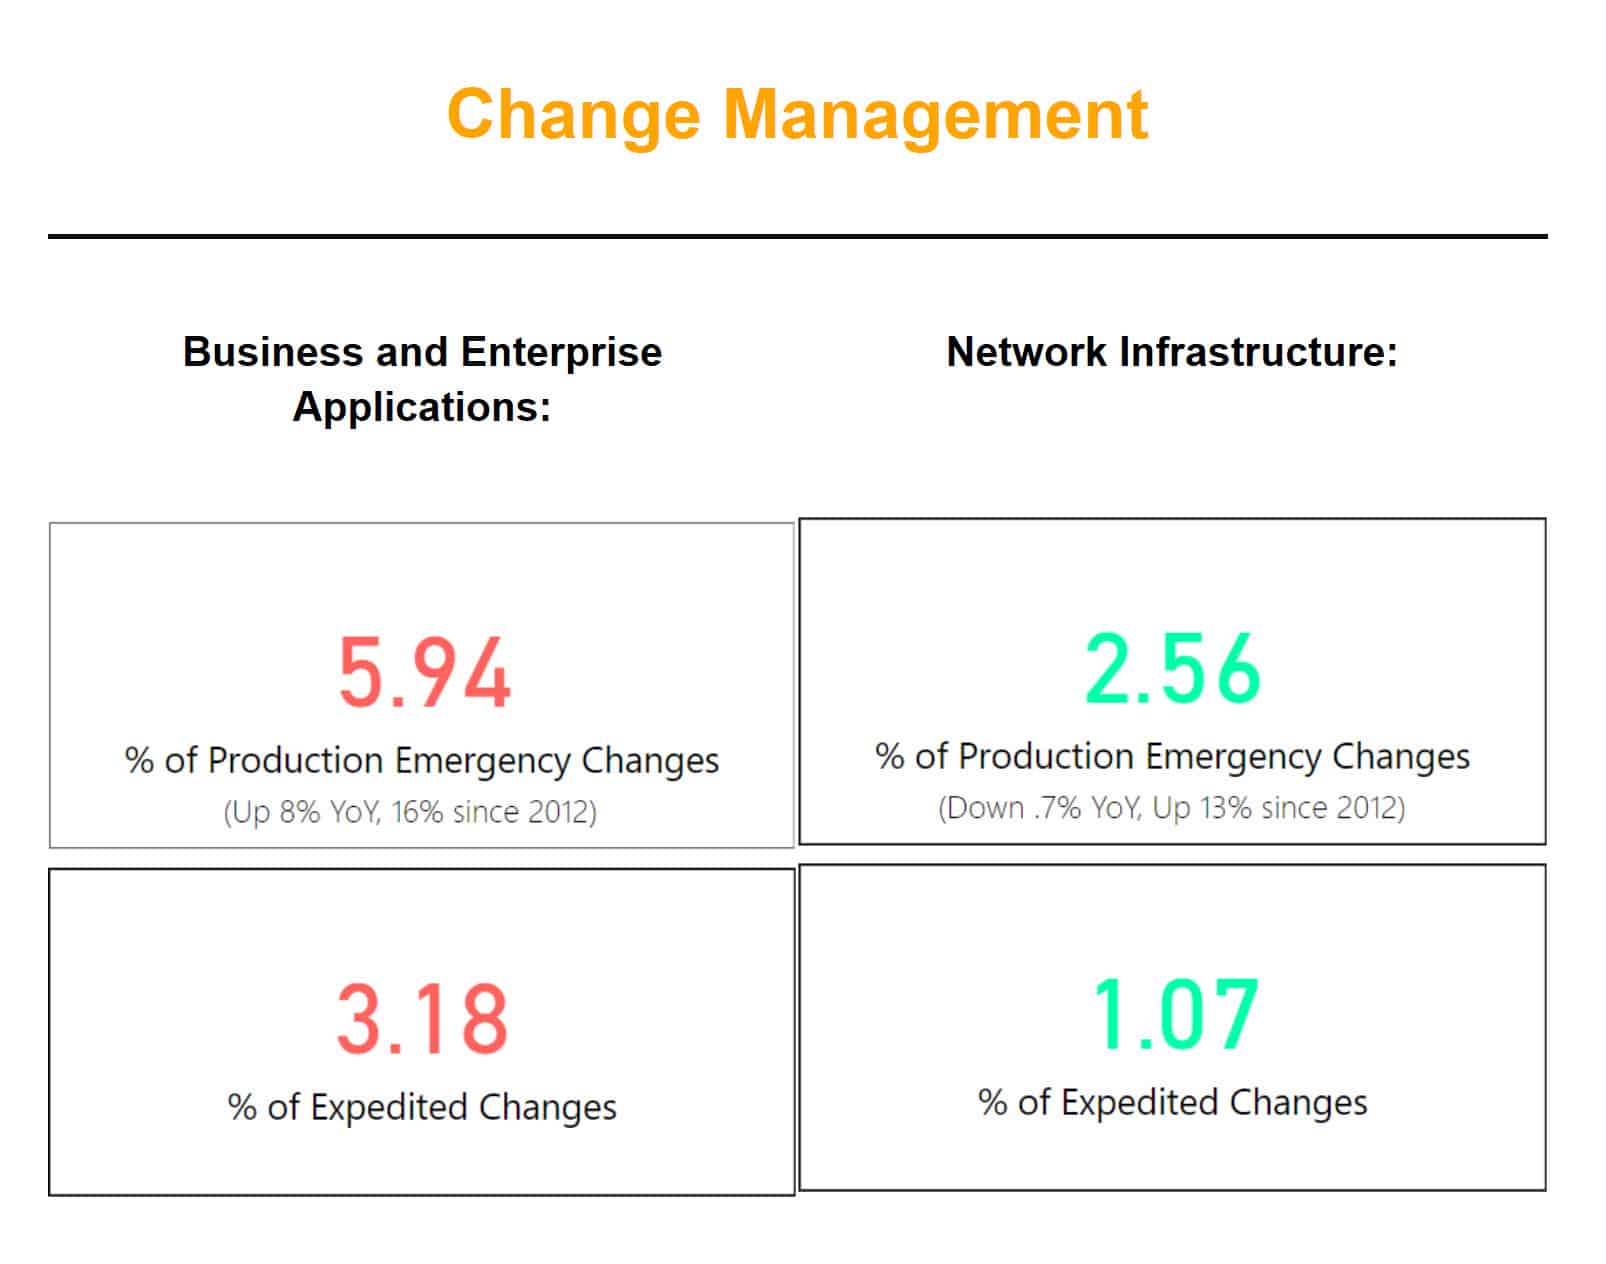
- With our unique multi-dimensional approach to benchmarking, we’ve been able to generate more granularity in our KPIs than previously thought possible. For example, rather than present a mostly meaningless average resolution time across all of IT Incidents, we will present average infrastructure resolution time, and even more importantly, median infrastructure resolution time (to eliminate the skew from un-closed/auto-close Incidents).
- With an annual subscription, based upon availability of the data in our massive repository, you’ll be able to request up to 5 custom measures from per year through our support center. As an example, if you’d like more granularity than infrastructure resolution time, to obtain network infrastructure resolution time (median or average), you’ll have the ability to create powerful business cases for your business initiatives.
- These measures apply to commercial organizations only. No federal, local, state or educational entities are represented.
- The combined multi-dimensional analysis (.MDX) uses > 1,000,000,000 records of machine-generated data.
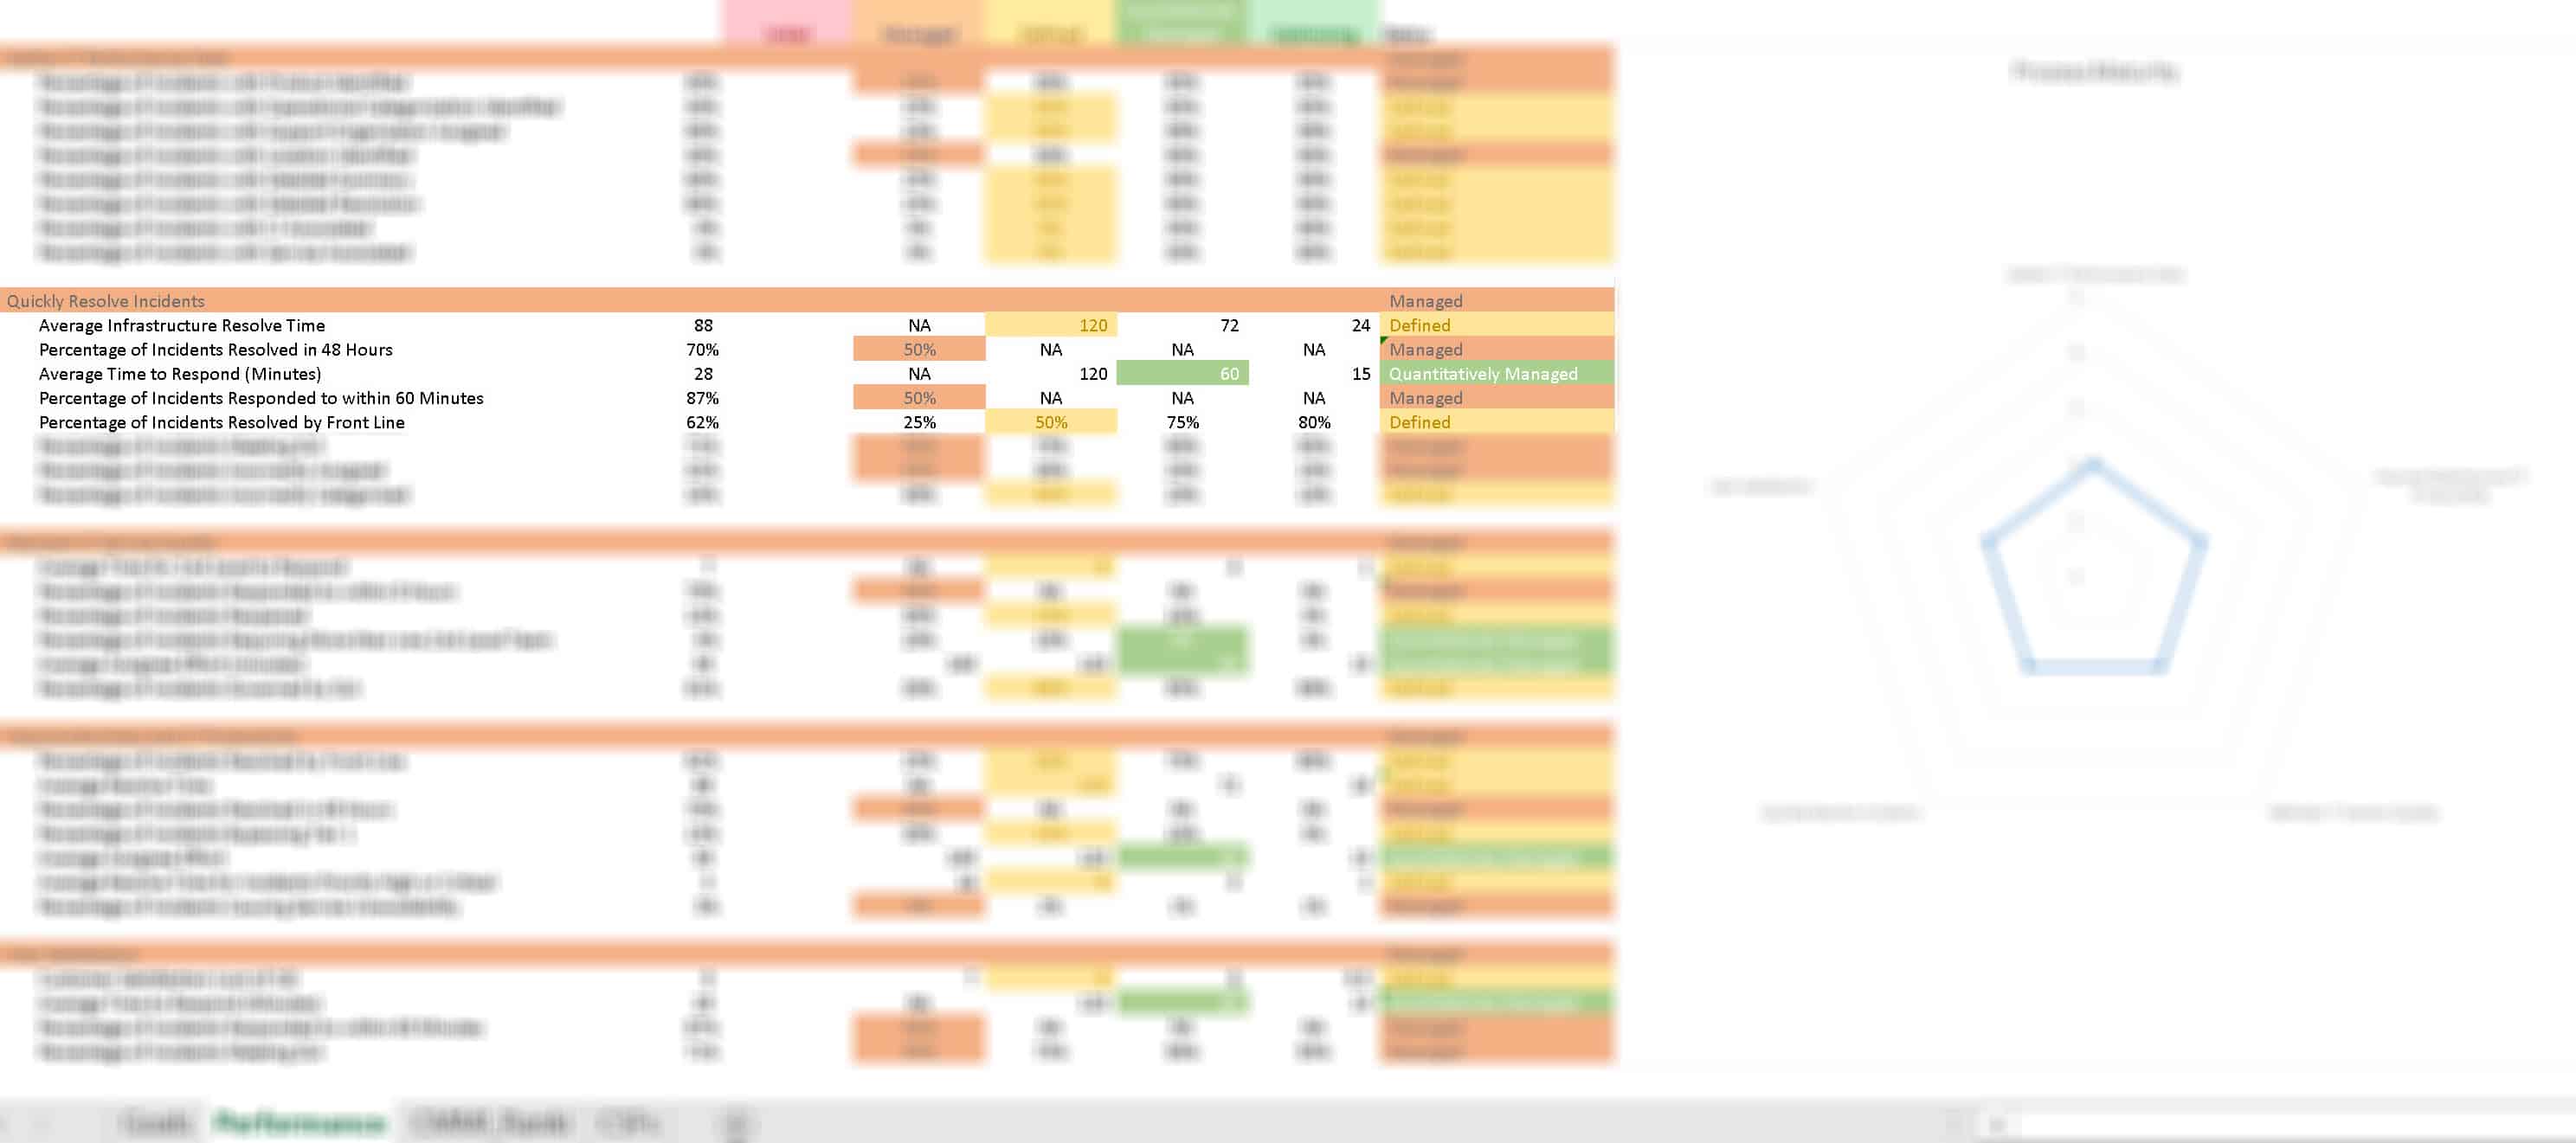
- We will provide an Excel spreadsheet (screenshot below) of industry numbers, with the capability to input your own which automatically calculates your quantitative score, and associated Radar diagram that will blow the doors off of any qualitative assesment you’ve seen in the past.
- If you have any questions, please feel free to call the 800 number to talk to a member of our sales team about PowerScore, or click contact us on the tab above.

